Are you an employee hoping to see more electric vehicles available in your company’s fleet? Share your voice today and become a driver for change. We have an anonymised tool available for you.
Car owners generally have a very low awareness of their vehicle lifetime costs. On average, people underestimate the total cost of owning a car by about 50%¹. It’s a misconception feeding the myth that electric cars are more expensive than their petrol and diesel competitors.
However, companies are TCO (Total Cost of Ownership) oriented. Before making any procurement decision the procurement managers or fleet managers should be analysing the total cost of ownership of vehicles — which includes not only the purchasing price, but also running costs, repairs, taxes, maintenance, depreciation and resale values. When that TCO analysis is made, battery electric cars (BEV) become the optimal investment², and few cost-related reasons remain for fleet managers not to encourage drivers to choose an electric vehicle.
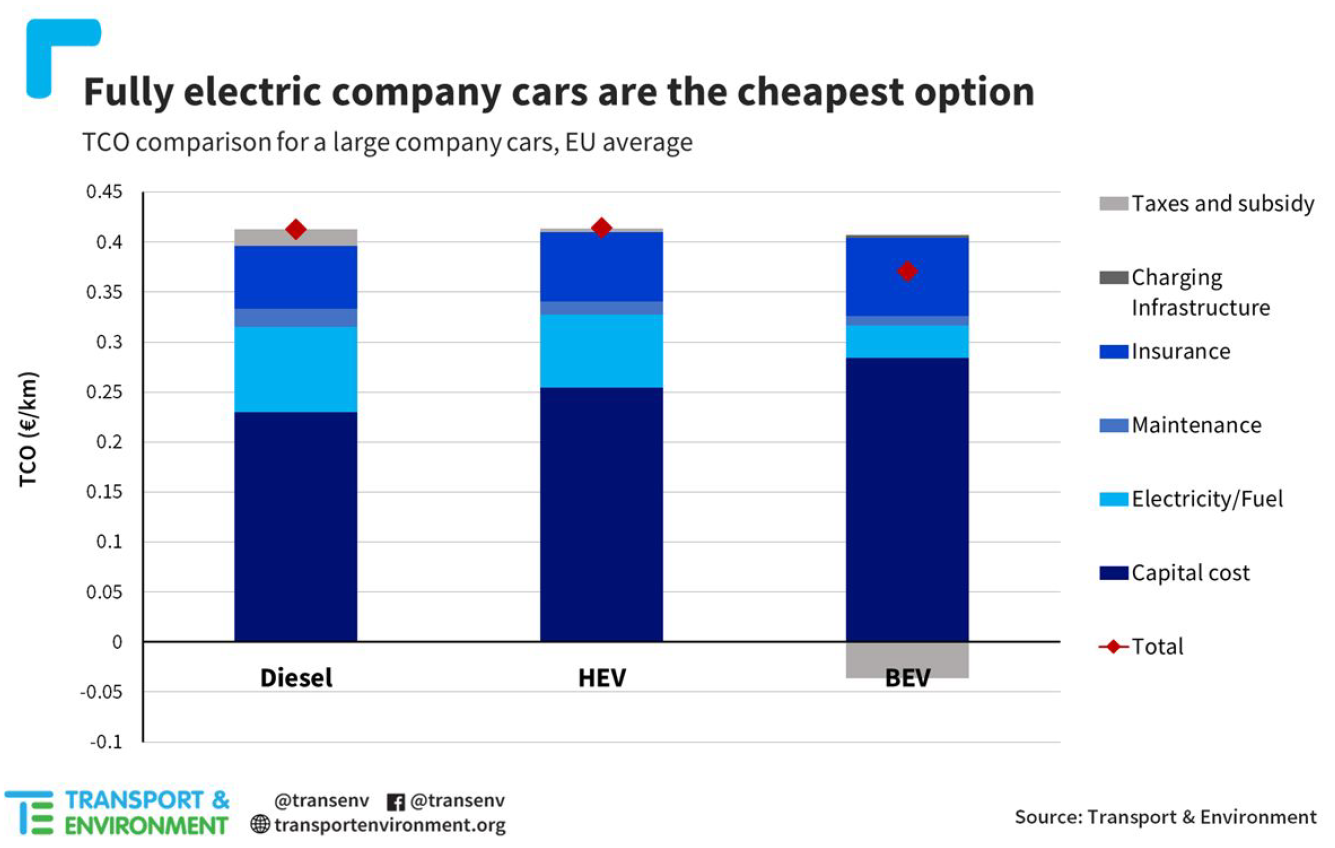
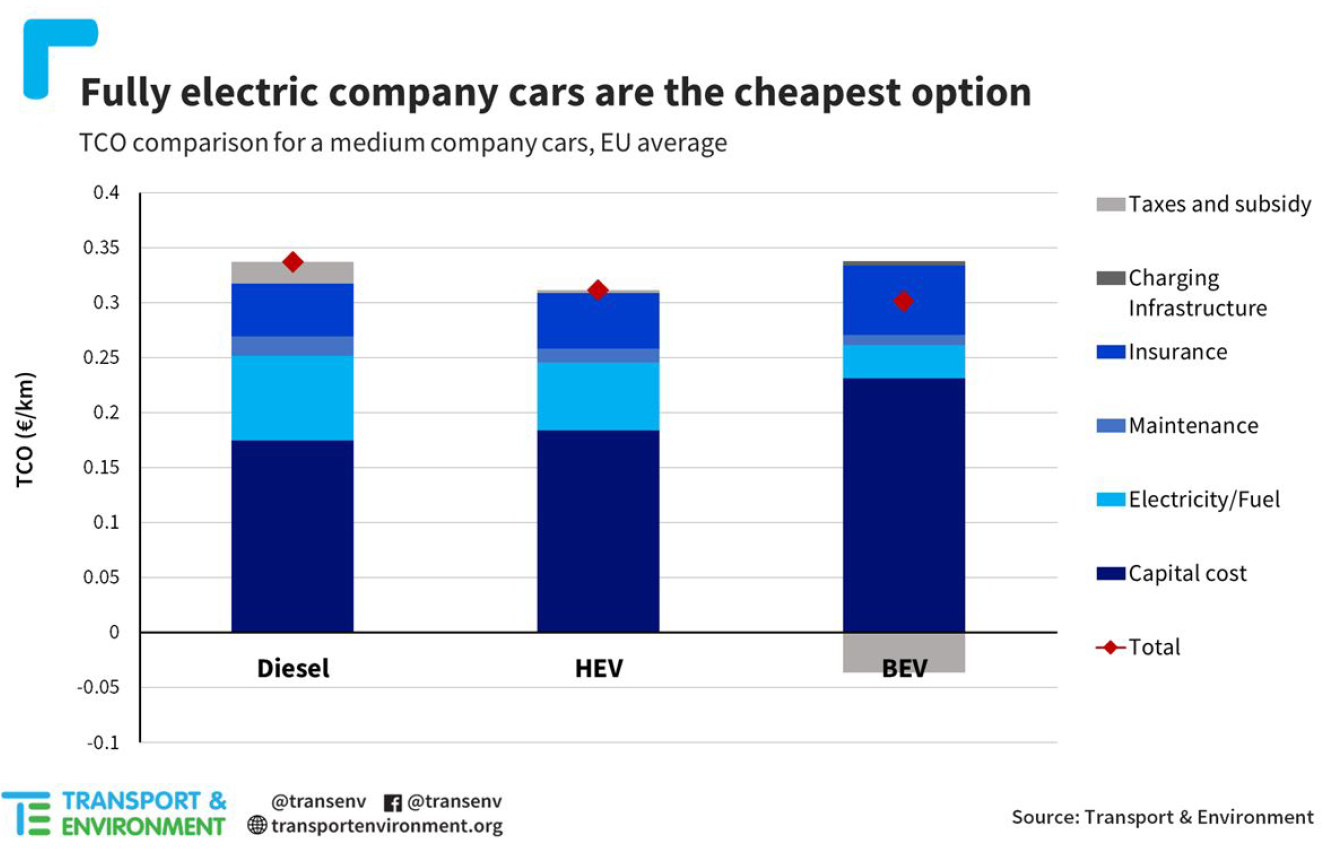
Fully electric company cars are already the cheapest option today in most European countries, both for large/premium and medium models³, as can be seen in the figures below displaying the T&E model calculations and results.
When looking at large/premium cars, our calculations show that the all-electric option is 9% cheaper than diesel on a per kilometer basis: 0.37 €/km vs. 0.41 €/km. This means that using an all-electric car instead of a diesel would save €4,320 on average over a 4-year period.
How did we calculate the TCO for large/premium cars?
We compared a Tesla Model 3 (BEV), a Mercedes C200e mild hybrid (HEV) and a Mercedes C180d (diesel), all driven 27,000 km per year, with a 4-year ownership period. For the Tesla Model 3 we included installation of a charging station into our cost calculations, and then used average oil and electricity prices from 2019, and a leasing contract with 8% finance rate. Residual values after 4 years were set at 35% (for all vehicles), and electricity and fuel consumption were extracted from Spritmonitor and EV-database —to reflect real-life conditions reported by users— while we used the prices in five key EU cities: Paris, Berlin, Madrid, Lisbon, and Brussels.
The same assumptions were used to perform the calculations for the medium size comparison: the all-electric vehicle selected is a Nissan Leaf 62 kWh, the hybrid is a Toyota Prius, and the diesel is a Skoda Octavia. And the results turn out to be strikingly similar: the all-electric Nissan Leaf is 12% cheaper than the diesel Skoda Octavia, and 3% cheaper than the Toyota Prius (HEV). The costs per km for each vehicle were: 0.30 €/km for the all-electric, 0.34 €/km for the diesel, and 0.31 €/km for the hybrid.
Both TCO calculations take into account the existing tax benefits for EVs, as seen in grey on the bar charts above and below, which shows that part of the TCO benefit comes from taxation policies favourable to EVs.
Why, then, do leasing companies still quote based on sticker price?
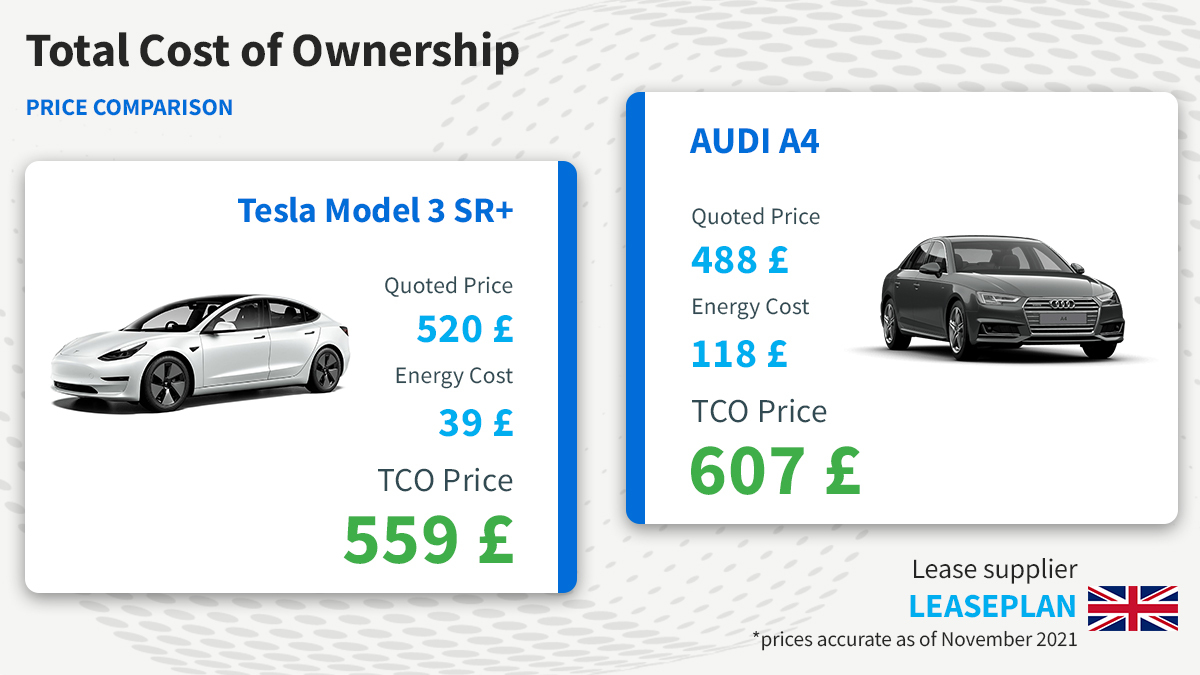
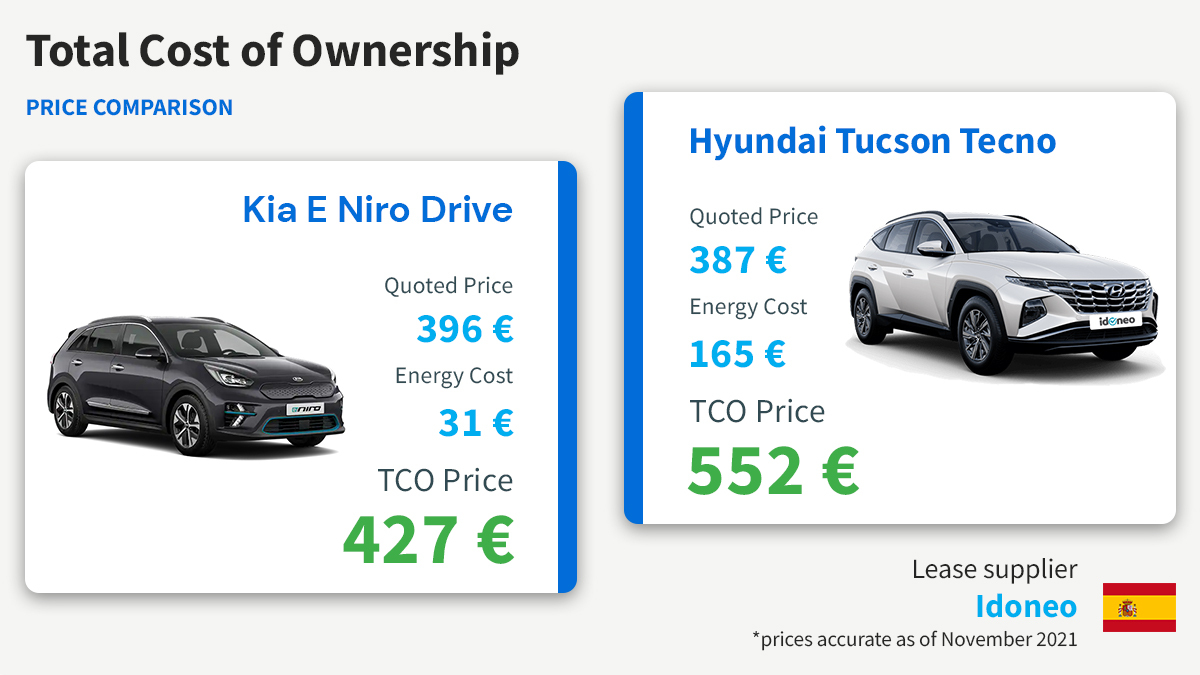
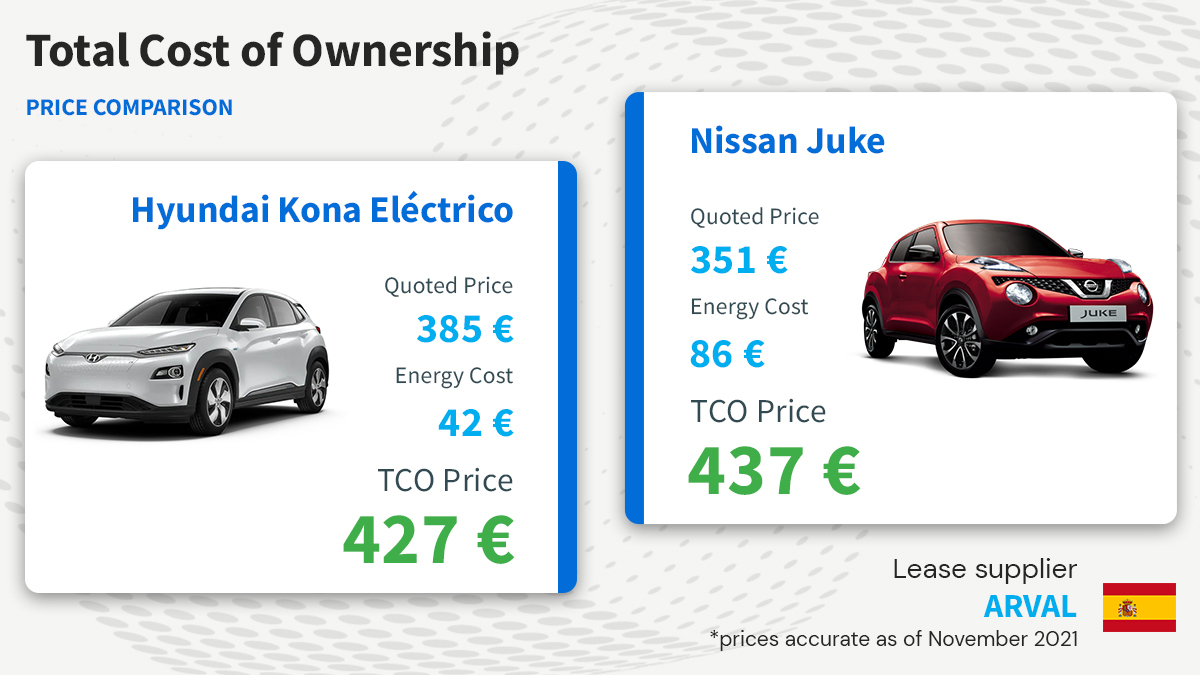
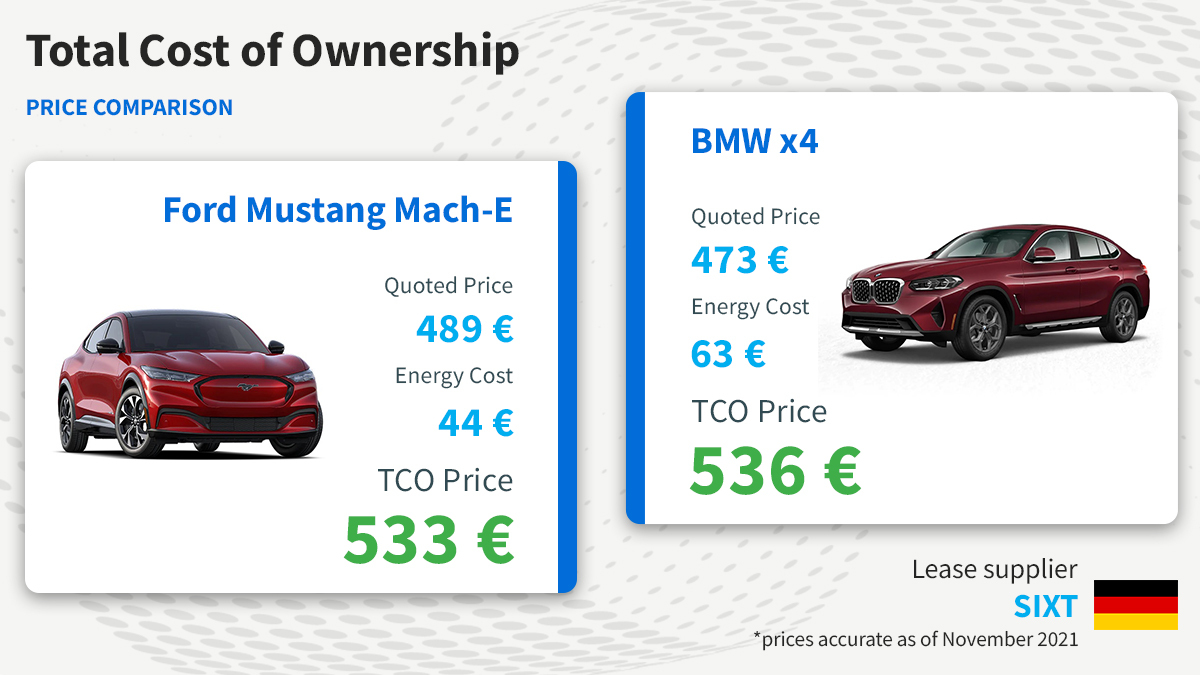
Displaying monthly prices that ignore the energy or fuel costs in leasing contracts with a predetermined distance driven throughout the lease period makes no sense. If we know we’re going to drive a specific distance per year —as determined by the leasing contract— shouldn’t we add that cost to the quoted price?
The problem is the leasing companies are not providing the energy or fuel, so they display only the costs of the services that they provide: vehicle rental, maintenance, servicing, tyres. Since the energy or fuel costs will be covered by the user —or by the company that employs the user— they are not included by leasing companies in the monthly price that is displayed.
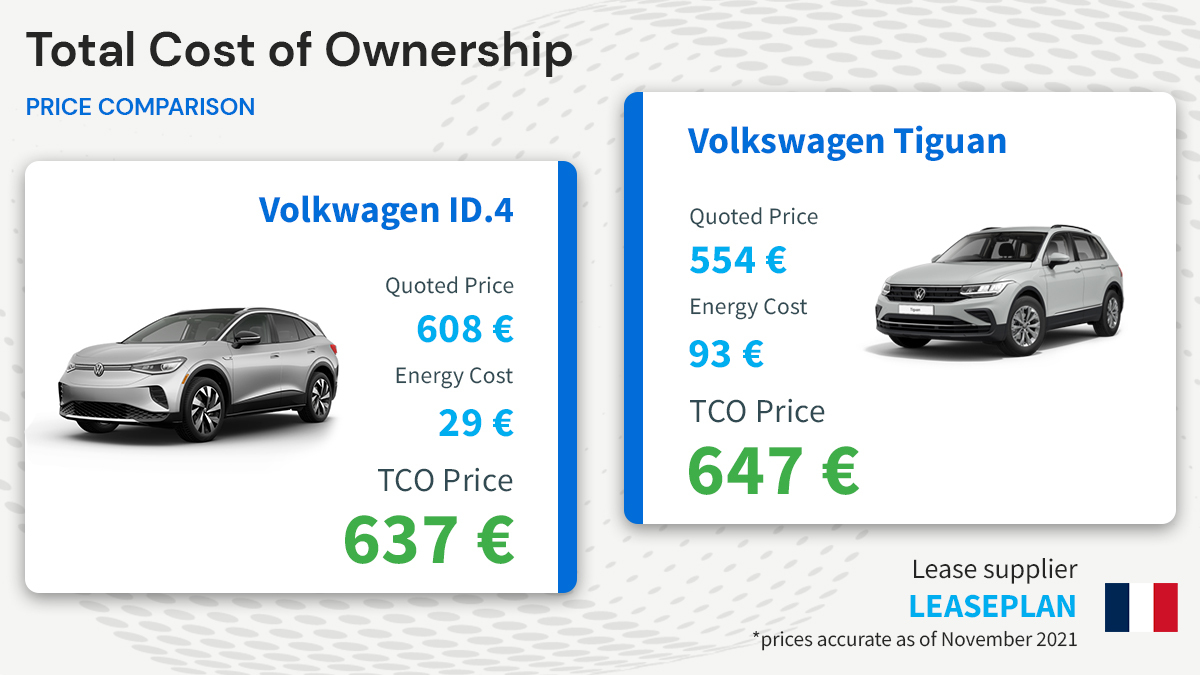
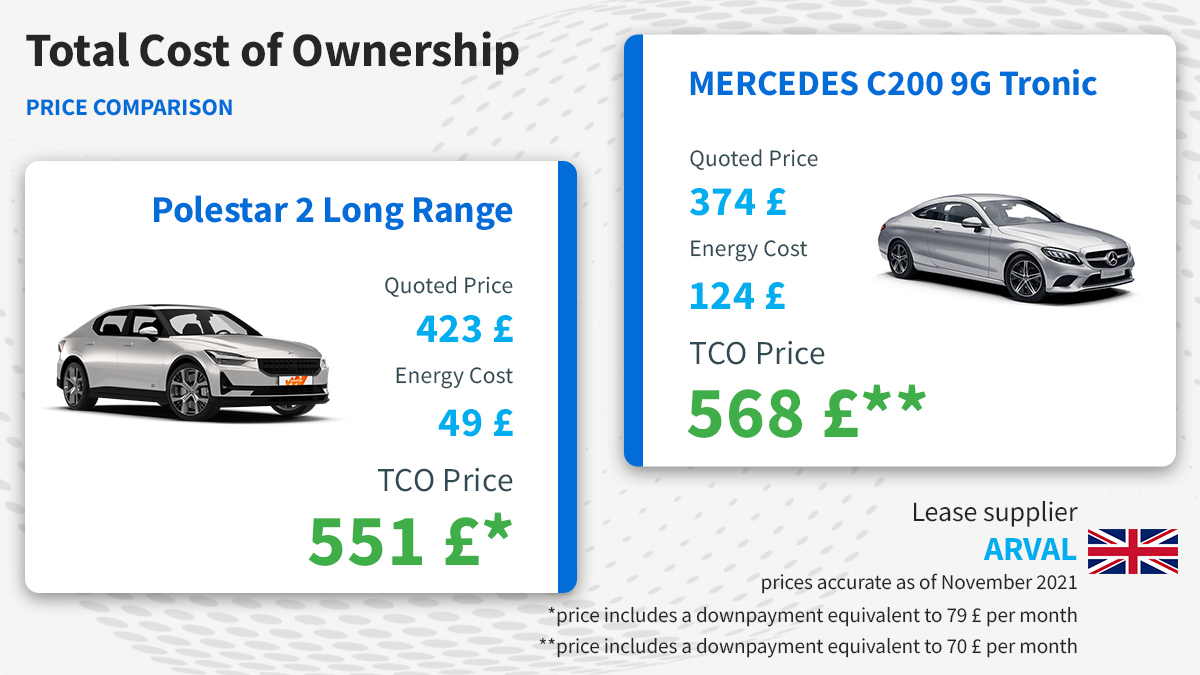
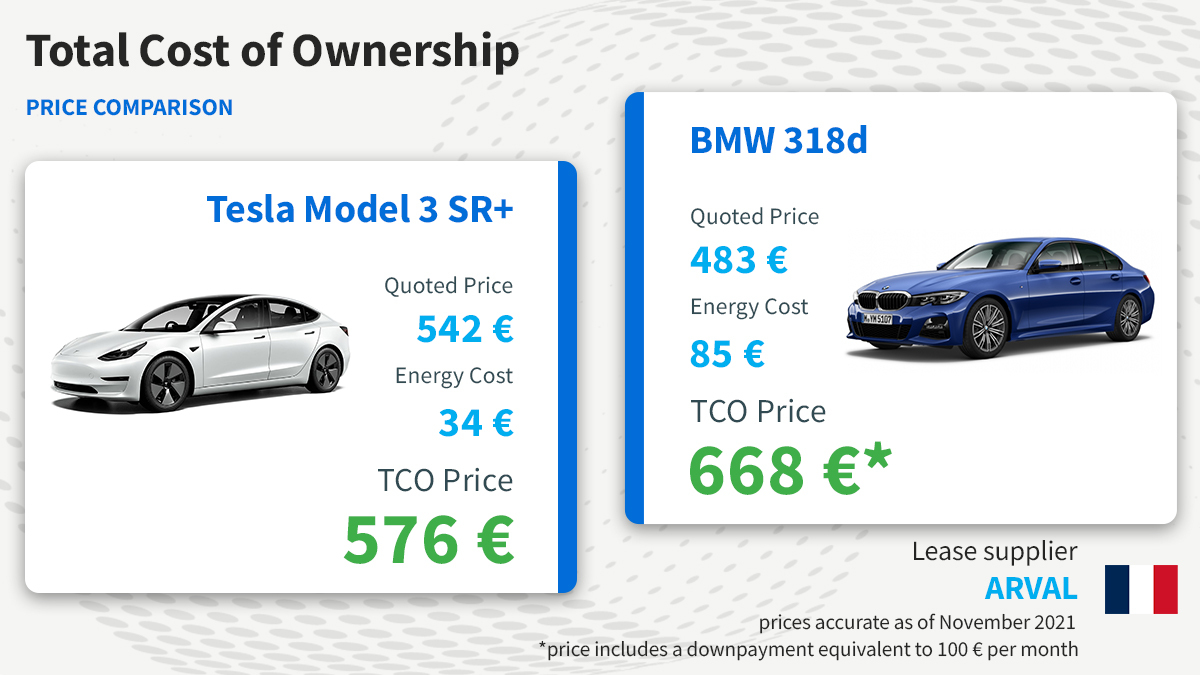
When leasing a car, is an EV or a diesel/petrol cheaper?
It’s time for leasing companies to tell consumers the Total Cost of Ownership
— Transport & Environment (@transenv) January 7, 2022
To provide the user with a more comprehensive overview, T&E has added the total cost of driving the distance found in the contract to the quoted price from the leasing company4. For example, in a 48 months lease that includes 15,000 km per year, we have checked the fuel prices and how much fuel the specific car model consumes per 100 km — using the official fuel consumption figures. We then multiplied that by the total distance travelled over 48 months, i.e. 60,000km. Having found the total cost of fuel, we then divided that total cost by 48 to find the monthly cost, and included that to the monthly price displayed by the leasing company. Unsurprisingly, the electric vehicle —that initially seemed more expensive— became the cheapest option.
This shows there is no business case anymore for companies to operate diesel or petrol vehicles in their fleets — unless companies face specific usage cases where the TCO calculation still shows EVs at a disadvantage.
Combining the TCO focus of companies with the fact that most countries provide fiscal benefits for companies who purchase EVs, it makes sense for companies and employees in Europe to go full electric starting now.
_____________________________
¹ Andor, M.; Gerster, A.; Gillingham, K; Horvath, M. (April 2020). Running a car costs much more than people think – stalling the uptake of green travel. Nature. Retrieved from https://www.nature.com/articles/d41586-020-01118-w
² Van der Goot, M. (2019, October 1). The Total Cost of Ownership of EVs vs Traditional Vehicles. Retrieved from https://www.leaseplan.com/en-ix/global-fleet-insights/tco-ev/
³ Leaseplan (2021, October 13) Plug cheaper than the pump in the majority of European countries, retrieved from https://www.leaseplan.com/en-ix/blog/tco/car-cost-index-2021/
4 The methodology used by T&E to calculate the monthly energy/fuel costs focused on taking a snapshot of actual prices at a specific moment in time. Official WLTP consumption figures from car manufacturers were used, together with prices quoted online by leasing companies. Fuel prices were taken from official data sources (Germany: Statista; France: Insee; Spain: RACE; UK: RAC UK), electricity prices were also gathered from official data sources (Germany: Eurostat; France: Eurostat; Spain: Eurostat; UK: Consumer Council) and price variations across regions, fuel stations, power suppliers, potential offers or discounts were not taken into consideration. This methodology does not apply price deviations to reflect different consumer behaviors (i.e. more home charging VS more fast charging for EV drivers, refueling at the most expensive highway fuel station VS the cheapest supermarket fuel station for diesel/petrol vehicle drivers) but rather tries to set a benchmark at a specific moment in time.
